

For VCs & PE Firms
Unified GTM Visibility
Across Your Entire Portfolio
Normalized metrics. ASR/AIS scoring. Cohort benchmarking. Fix tracking. Board-ready visibility - with zero extra work from operators.
The Portfolio Problem
Quarterly Updates Conceal More Than They Clarify
Without Standardized GTM Monitoring:
- Every portco reports in its own version of reality
- Metrics are inconsistent and not benchmarked across holdings
- Board decks gloss over pipeline coverage and efficiency leaks
- Investors can't see recurring risks across the portfolio
- CEOs get advice instead of operator-grade systems
- Real GTM risks stay buried until they show up in margin pressure or missed quarters
Alpine Portfolio Monitoring gives funds and operators the same clear, system-level visibility into GTM performance - company by company or across the portfolio.
What Portfolio Monitoring Delivers
Real GTM Visibility. Not Quarterly Theater.
Unified dashboard for VCs and PE firms. Standardized metric normalization, ASR and AIS scoring by company and cohort, fix velocity tracking, and board-level clarity.
Normalized Metrics
25 standardized GTM metrics across all portfolio companies. Same benchmarking logic, same diagnostic intelligence, same measurement standards.
ASR & AIS Scoring
Alpine Signal Rating (ASR) and Alpine Infrastructure Score (AIS) for every portco. Compare by company, cohort, sector, and stage maturity.
Cohort Benchmarking
See how each company performs against peer cohorts by ARR band, growth stage, and sector. Identify outliers instantly.
Fix Velocity Tracking
Track which companies are shipping fixes, which ones drive measurable ROI, and where execution is stuck or margin is leaking.
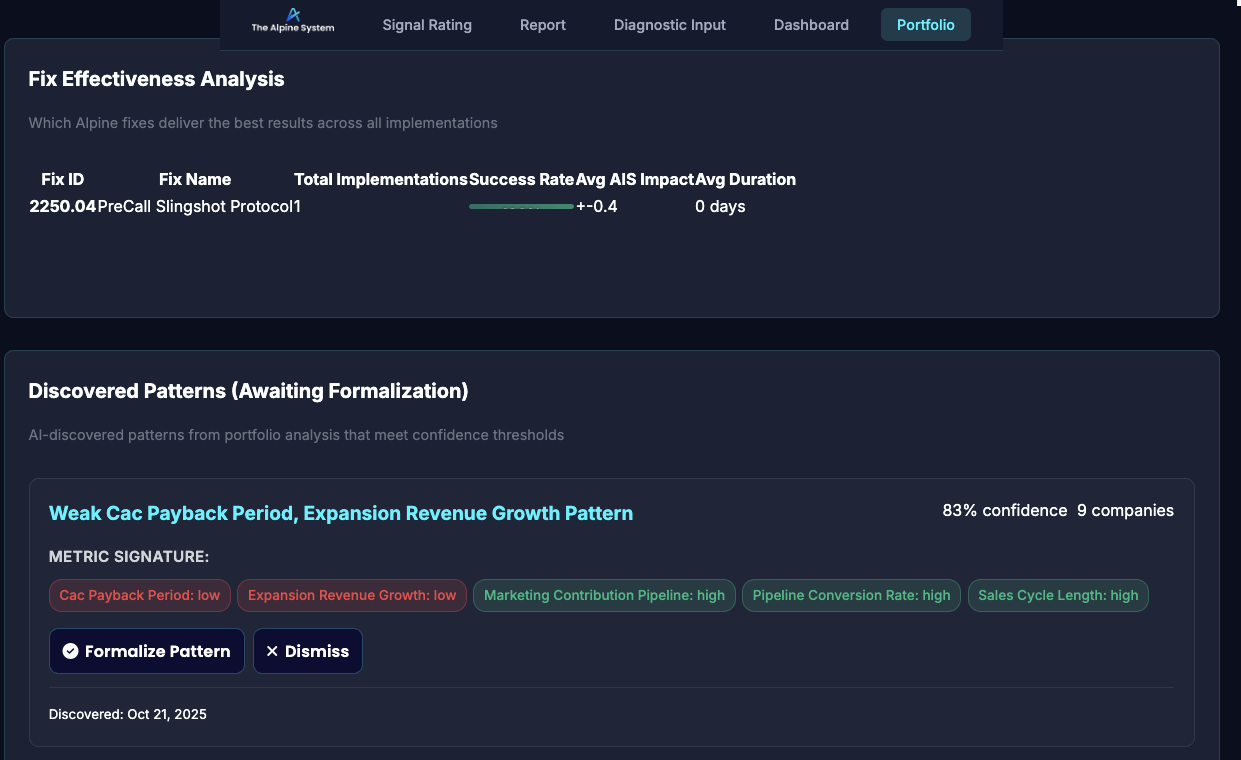
Pattern Recognition
Spot recurring GTM breakdowns across the portfolio — then apply tested fixes at scale to eliminate repeat failure modes.
Zero Operator Burden
API integrations feed metrics automatically. Operators don't create custom reports for investors - the system does it for them.
Dashboard Views
Multi-Company Visibility. Instant Insights.
Four core dashboard views for portfolio-level intelligence.

Client/Investment View · Roll-Up insights · Activation awareness
1. Portfolio Overview
All portfolio companies in one view. ASR/AIS scores, ARR band, growth stage, and last diagnostic date. Sortable, filterable, and exportable.
- • Company-level ASR/AIS scores
- • ARR, headcount, sector classification
- • Recent fix activity and ROI tracking
- • Red flags and margin leak alerts
2. Cohort Analysis
Compare performance across peer cohorts. Group by ARR band, vintage year, sector, or custom segments. Identify portfolio-wide patterns.
- • Average ASR/AIS by cohort
- • Metric distribution and outlier detection
- • Fix velocity by cohort
- • Recurring failure patterns
Assess and track revenue capture and creation by investment and across portfolio
3. Company Deep Dive
Click into any portco for full diagnostic breakdown. 25 metrics, causality map, fix priorities, ROI projections, and execution status.
- • Full Infrastructure Diagnostic results
- • Causality mapping and root cause analysis
- • Fix deployment timeline and status
- • ROI tracking and financial impact
4. Board Reporting
Auto-generated board reports for LPs, investment committees, and annual meetings. Export to PDF or slide deck with one click.
- • Portfolio health summary
- • Cohort performance analysis
- • Fix velocity and ROI realized
- • Ops maturity trends over time
Key Features
Built for Investment Committee Clarity
Standardized Metric Normalization
Every portco measured with the same 25 metrics, benchmarked by business maturity. No more apples-to-oranges comparisons. Same diagnostic logic across all holdings.
ASR™ and AIS™ Scoring
Alpine Signal Rating (ASR) - Directional GTM health score (0-100). Alpine Infrastructure Score (AIS) - Deep diagnostic score across Pipeline, Conversion, Expansion. Track both by company, cohort, and over time.
Cohort-Based Benchmarking
Group companies by ARR band ($1M-$5M, $5M-$15M, $15M-$30M, $30M+), vintage year, sector, or custom segments. See median, quartiles, and outliers instantly.
Fix Velocity & ROI Tracking
Monitor which portcos are deploying fixes, which fixes are delivering ROI, and where execution is stalled. See margin recovery and revenue impact in real-time.
Execution Maturity Scoring
Beyond metrics - track operational maturity across GTM systems. See which companies have installable infrastructure vs ad-hoc processes.
Pattern Recognition at Scale
The system identifies recurring GTM failures across multiple holdings. See portfolio-wide patterns (e.g., "8 out of 12 growth-stage companies have broken ICP definition").
API Integration & Auto-Feeds
HubSpot, Intuit, and other system integrations feed metrics automatically. Operators don't create custom reports - the system pulls data directly.
White-Label Option
Deploy Alpine Portfolio Monitoring under your fund's branding. Custom domains, logos, and investor-facing reports for LP communications.
Use Cases
Who Uses Portfolio Monitoring
Designed for fund partners, portfolio ops teams, and investment committees.
VC/PE Fund Partners
Unified GTM visibility across 10-50 portfolio companies. See which holdings have margin risk, which fixes are deploying, and where board intervention is needed.
Portfolio Operations Teams
Systematic GTM support across all portcos. Identify recurring issues, deploy proven fixes at scale, and track execution maturity over time.
Investment Committees
Board-ready reporting for quarterly reviews, annual meetings, and LP communications. Defensible metrics, cohort analysis, and ops maturity scoring.
Annual Portfolio Reviews
Complete portfolio health assessment. Benchmark all holdings, identify outliers, prescribe systematic fixes, and forecast margin recovery potential.
New Fund Onboarding
Establish GTM baseline for all portfolio companies within 30 days. Standardized diagnostics, cohort benchmarking, and fix prioritization from day one.
Pre-Exit Preparation
Audit GTM infrastructure 6-12 months before exit. Install fixes that improve sale multiple, demonstrate operational maturity, and de-risk acquirer diligence.
Sample Portfolio Metrics
What Gets Measured & Tracked
Example metrics across a 20-company growth-stage portfolio.

Line charts showing ASR trends over 12 months for entire portfolio. Cohort comparison showing $5M-$15M ARR companies vs $15M-$30M. Fix deployment timeline by company.
How It Works
Setup → Integration → Ongoing Monitoring
Portfolio Onboarding
List all portfolio companies. Alpine runs Infrastructure Diagnostic for each holding (self-service or guided). Baseline ASR/AIS scores established within 30 days.
API Integration
Connect HubSpot, Intuit, and other systems for automatic metric feeds. Operators grant read-only API access. Zero ongoing reporting burden.
Dashboard Activation
Portfolio dashboard goes live. Fund partners and ops teams get login credentials. Set up cohort filters, custom segments, and alert thresholds.
Ongoing Monitoring & Reporting
Metrics update automatically. Fix deployments tracked in real-time. Quarterly board reports generated with one click. Pattern recognition improves with scale.
Setup typically takes 2-4 weeks for a 10-20 company portfolio. Ongoing monitoring requires zero operator effort after API integration.
Portfolio Monitoring Pricing
Priced by portfolio size and monitoring depth. Annual subscriptions with optional white-label deployment for investor ecosystems.
See Pricing Details
See What the Board Deck Doesn’t Show..
Install Portfolio-Wide GTM Monitoring.
Unified dashboard. Standardized metrics. Cohort benchmarking. Fix tracking. Zero operator burden.