

The Alpine System
Diagnostic GTM Infrastructure.
Engineered for Precision.
Built from 15+ years of Tier-1 GTM deployments. 27 AI agents work in sync to diagnose issues, prioritize fixes, and model ROI—backed by operational benchmarks.
The GTM Terrain
Pipeline · Conversion · Expansion
Mapped
Every B2B company runs three motions: Pipeline, Conversion, Expansion. The Alpine System maps each one - with entry/exit criteria, role ownership, and financial triggers - to clarify how revenue flows.
Pipeline
The motion that identifies, attracts, and qualifies prospects who match your ICP and are ready to engage.
Typical Stages Mapped
- Awareness & Intent Signal
- Inbound Lead Capture
- Outbound Prospecting
- Qualification & Discovery
- Meeting Set / Demo Scheduled
Conversion
The motion that moves qualified prospects through evaluation, decision, and commitment with velocity and margin efficiency.
Typical Stages Mapped
- Needs Assessment / Scoping
- Proposal & Commercial Terms
- Negotiation & Legal
- Commit & Close
- Onboarding Handoff
Expansion
The motion that ensures customers realize value, stay longer, expand spend, and become advocates over time.
Typical Stages Mapped
- Onboarding & Activation
- Value Realization
- Adoption & Usage Growth
- Renewal & Retention
- Upsell / Cross-sell / Advocacy
The System doesn't just map stages. It defines entry/exit criteria, role ownership, transition triggers, and quantifies financial impact at every step.
So your team can see the system, not just the symptoms.
Diagnostic Mechanics
25 Core GTM Metrics.
Benchmarked Intelligence.
The system scores your GTM using 25 core metrics - benchmarked by ARR band, team size, business model, and GTM maturity - to surface the real blockers to scale.
How Benchmarking Works
Business Maturity Classification
Your company is classified by ARR band ($1M-$5M, $5M-$15M, $15M-$30M, $30M+) and employee count to determine appropriate peer benchmarks.
Sector-Specific Benchmarks
SaaS, professional services, and tech-enabled services have different GTM benchmarks. The system adjusts expectations based on your business model.
GTM Stage Normalization
Early-stage companies (founder-led sales) are measured differently than growth-stage (institutionalized GTM) or mature-stage (scaled operations).
Missing Data Intelligence
Don't have all 25 metrics? The system intelligently bypasses gaps and adjusts scoring logic. You get actionable insights even with incomplete data.
Sample Metrics Analyzed
Quota Attainment %
Percentage of sales reps hitting quota. Benchmarked by team size and GTM maturity.
Magic Number
Net new ARR ÷ prior-quarter S&M spend. Efficiency benchmark varies by growth stage.
CAC Payback (Months)
Months to recoup customer acquisition cost. Critical margin efficiency metric.
Win Rate %
Opportunities closed-won ÷ total opportunities. Conversion motion health indicator.
Net Revenue Retention (NRR)
Annual recurring revenue from existing customers. Expansion motion effectiveness.
Gross Revenue Retention (GRR)
Revenue retention before expansion. Foundation health metric.
Average Sales Cycle (Days)
First meeting to closed-won. Velocity benchmark by deal size and complexity.
Pipeline Coverage Ratio
Pipeline value ÷ quota. Leading indicator of forecast confidence.
Full 25-metric breakdown included in Infrastructure Diagnostic results. Request your benchmark analysis below.
The Intelligence Layer
27 AI Agents.
Coordinated Precision.
Human-crafted causality maps from 15+ years of GTM pattern recognition. AI-enhanced execution through specialized agent departments that coordinate metric analysis, fix prescription, and ROI modeling.
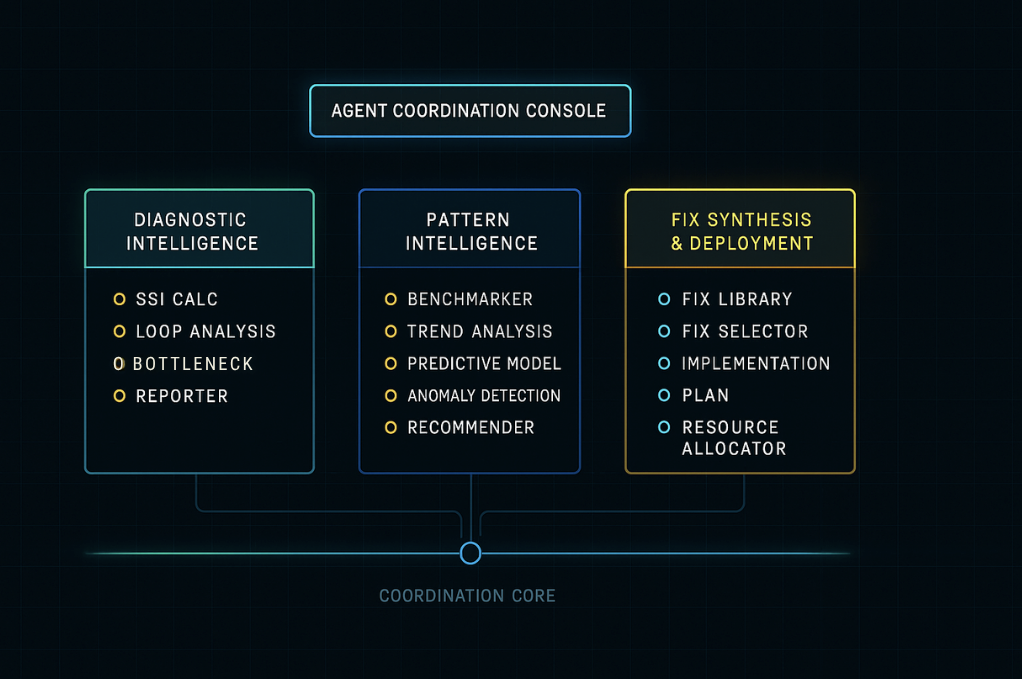
Visual map showing how 27 specialized agents work across 6 departments: Metric Analysis · Causality Mapping · Fix Prescription · ROI Modeling · Confidence Scoring · Report Generation
Agent Departments & Functions
Metric Analysis Department
Diagnostic Agents (5 agents)
Ingest 25 core metrics, identify gaps, normalize by business maturity, and flag outliers against peer benchmarks. Agents handle missing data intelligently and adjust scoring logic dynamically.
Causality Mapping Department
Pattern Recognition Agents (4 agents)
Map which broken metrics predict downstream revenue failure. Built from actual company data showing causal relationships between pipeline inefficiency, conversion drag, and expansion decay. Not correlation - causation.
Fix Prescription Department
Prioritization & Execution Agents (6 agents)
Match diagnosed gaps to proven fix library. Prioritize by ROI, business stage, and team capacity. Generate implementation sequences with dependencies, timelines, and resource requirements.
Financial Intelligence Department
ROI Modeling Agents (5 agents)
Calculate Annual Direct Cost + Opportunity Cost + Total Fix Value for every prescribed fix. Model 6-month, 12-month, and 24-month ROI projections based on your actual business metrics. Instant financial clarity.
Confidence Scoring Department
Validation & Quality Agents (4 agents)
Assign confidence scores to every diagnosis, fix recommendation, and ROI projection. Flag low-confidence outputs for human review. Ensure diagnostic quality compounds with every deployment.
Translation & Reporting Department
Executive Language Agents (3 agents)
Auto-translate technical diagnostics into plain executive language. Generate board-ready reports with clear explanations of what's broken, why it matters, and how to fix it. No jargon. No black boxes.
Every deployment teaches the system. Pattern recognition improves with scale. The more companies that use Alpine, the more precise the diagnostics become.
Predictive Causality
Downstream Failure Mapped Upstream
The system doesn't just identify broken metrics. It traces which upstream failures cause downstream revenue problems. Built from actual GTM deployments across Tier-1 VC portfolios.
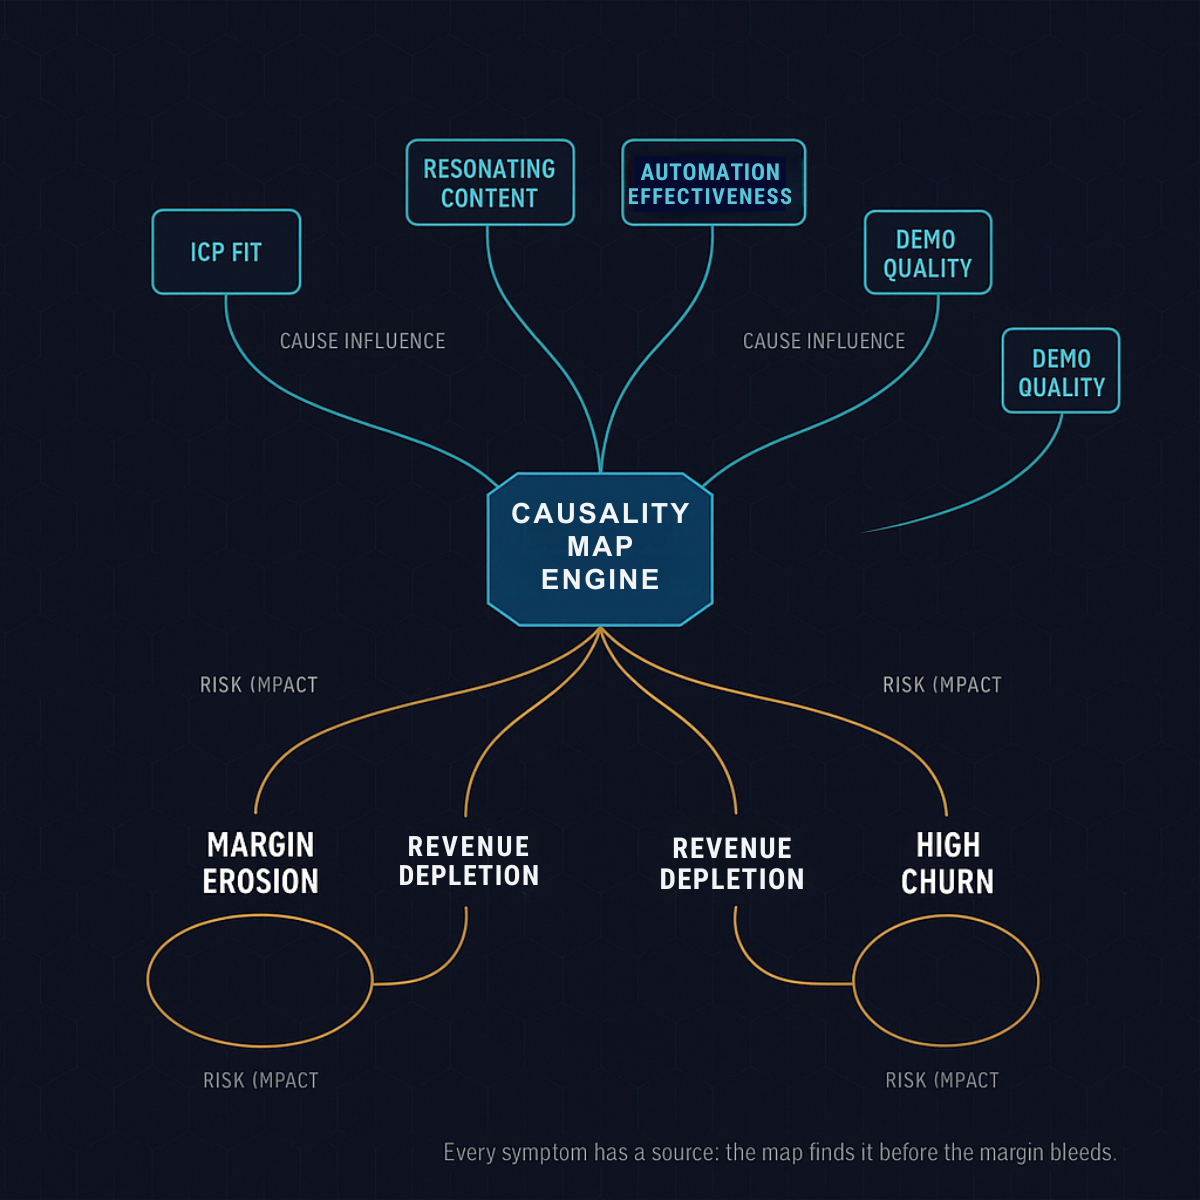
Visual graph showing causal relationships: broken ICP → pipeline bloat → conversion drag → churn risk. Each node includes metric health, fix priority, and ROI impact.
Example: Pipeline Bloat
Upstream Cause
Broken ICP definition → wrong-fit leads enter pipeline
Midstream Effect
Sales cycles extend as reps chase unqualified prospects
Downstream Impact
Win rates collapse, CAC swells, churn risk climbs
System Prescription
Fix ICP first → pipeline quality improves → conversion velocity increases → margin recovers
Example: Expansion Decay
Upstream Cause
No onboarding SLAs → customers don't activate properly
Midstream Effect
Time-to-value extends, adoption stalls, value realization delays
Downstream Impact
NRR drops, GRR decays, expansion revenue disappears
System Prescription
Install onboarding rhythm → activation improves → retention strengthens → expansion compounds
This isn’t symptom chasing. It’s predictive causality analytics - tracing failures to their root cause and prescribing revenue-positive repairs.
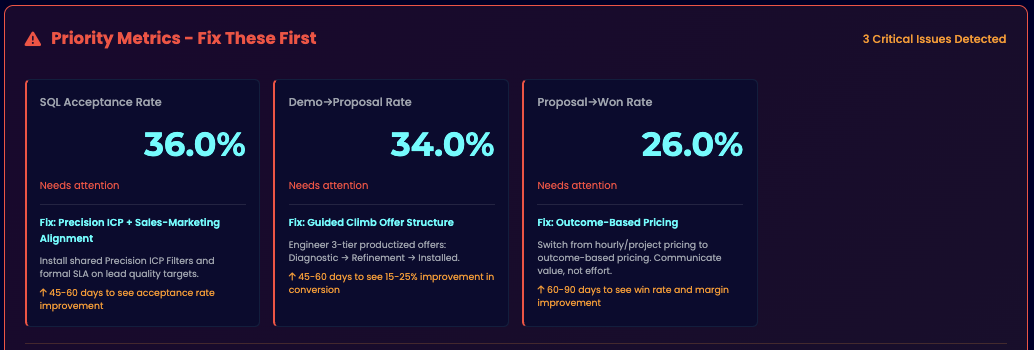
Fix Prioritization Engine
ROI-Driven. Stage-Aware.
Fixes are ranked by financial impact, effort, stage readiness, and resource load - so your team knows what to fix, when, and why.
2x2 matrix: Impact (high/low) vs Effort (high/low). Each fix plotted with ROI score, timeline, resource requirements, and dependency chain.
Fix Scoring Factors
- • Annual Direct Cost - Hard dollar expense of broken process (wasted payroll, lost deals, excess churn)
- • Opportunity Cost - Revenue not captured due to inefficiency (pipeline leakage, slow cycles, missed expansion)
- • Total Fix Value - Combined financial recovery potential over 12/24 months
- • Implementation Effort - Time, resources, and organizational lift required
- • Stage Readiness - Is your business mature enough for this fix to stick?
Example Fix ROI Breakdown
Fix: Install ICP Definition + Lead Scoring
Annual Direct Cost: $180K (wasted payroll chasing unqualified leads)
Opportunity Cost: $340K (missed revenue from poor pipeline quality)
Total Fix Value (12mo): $520K
Implementation Effort: 3 weeks, minimal disruption
→ Priority Score: 9.2/10 (High ROI, Low Effort)
Financial Intelligence Module
Instant ROI Modeling.
Transparent Impact.
Every prescribed fix includes financial impact modeling. No guesswork. No vague "efficiency gains." Hard-dollar ROI tied to your actual business metrics.
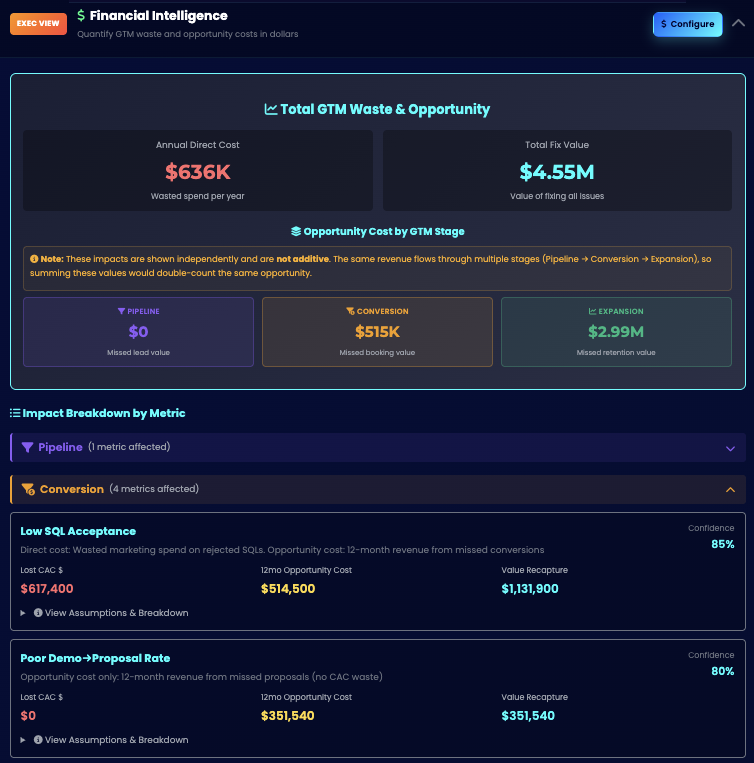
ROI projections for each fix: 6-month, 12-month, 24-month value. Waterfall charts showing cost recovery timeline. Sensitivity analysis for different adoption scenarios.
What Financial Intelligence Delivers
Cost Transparency
Direct costs (payroll waste, lost deals) and opportunity costs (pipeline leakage, churn) quantified for every broken process.
ROI Projections
6-month, 12-month, 24-month value modeling based on your actual ARR, team size, and GTM metrics - not industry averages.
Sensitivity Analysis
Best case / base case / worst case scenarios for each fix. Understand downside protection and upside potential.
Board-ready financial clarity. Investment committee transparency. Operator-grade precision. That's what Financial Intelligence delivers.
This Is Infrastructure.
Not Guesswork.
Engineered intelligence. Pattern-driven prioritization. Transparent financial ROI.